
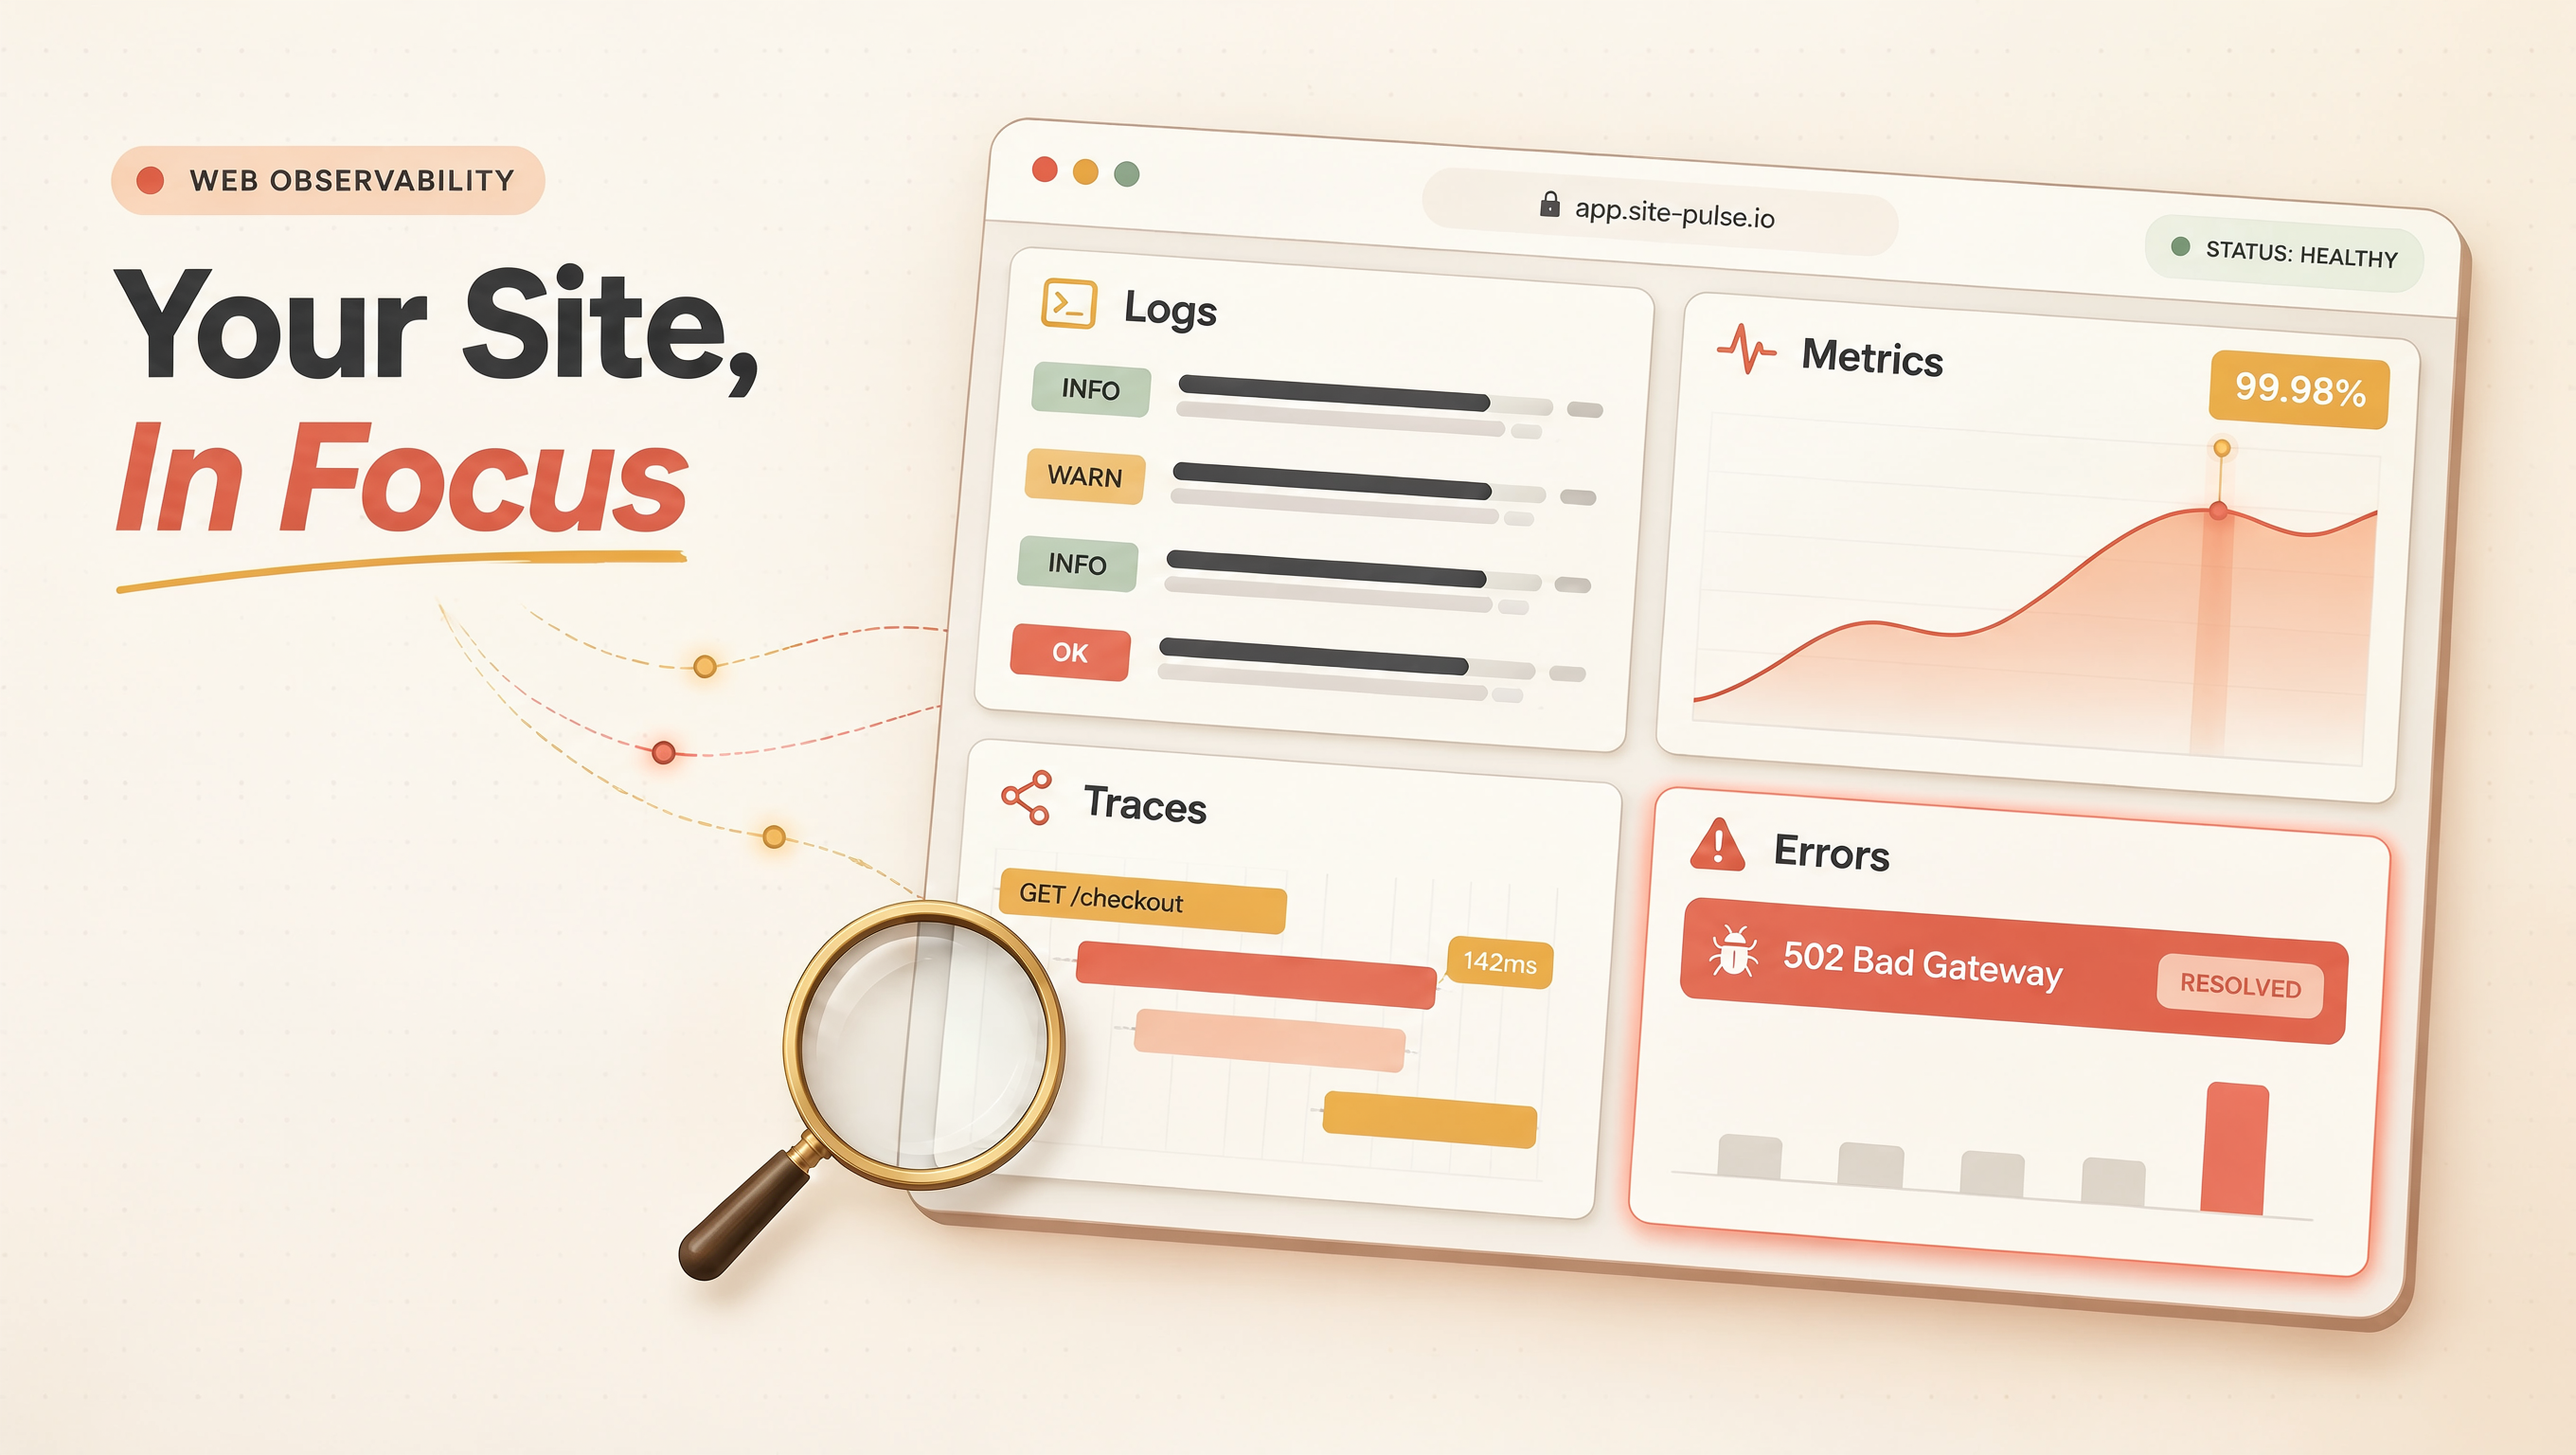
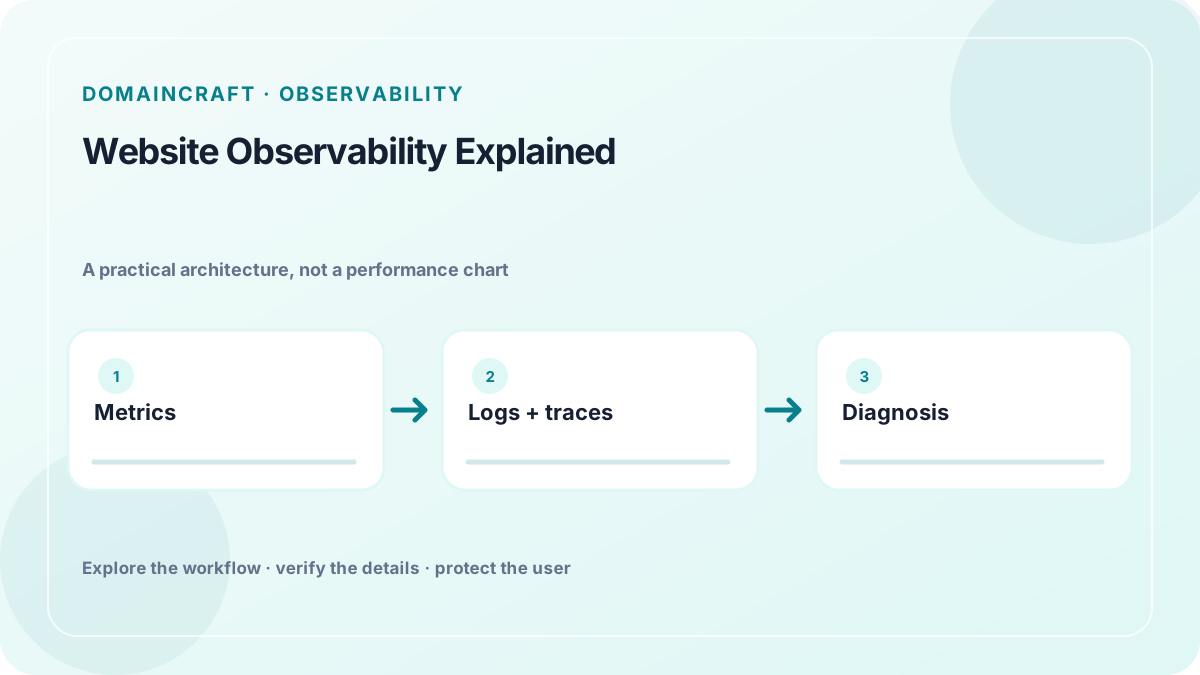
 Original local vector schematic. It is explanatory artwork, not measured performance or market data.
A website can appear to be “up” while its search function returns errors, its checkout is slow, or one customer’s requests fail in a particular region. Basic monitoring tells an operator when a known check crosses a threshold. Observability uses the system’s outputs to investigate why an unfamiliar problem occurred. The distinction is practical: alerts identify a symptom; logs, metrics, and traces help explain the path that produced it.
Quick answer: Logs record events, metrics summarize measurements over time, and traces connect the work performed during one request across services. Use all three with error monitoring and user-facing checks. For a domain generator, monitor whether the page loads, generation completes, lookups time out, and API errors rise—while avoiding the collection of unnecessary candidate names or other sensitive inputs.
Monitoring and observability
Monitoring usually asks whether predefined conditions are healthy: Is the site reachable? Is the error rate above a limit? Is a dependency responding? It is valuable for detecting recurring problems that the team already understands.
Observability asks what can be inferred about a system’s internal state from its outputs. When a problem was not anticipated, an operator can use request logs, metrics, traces, and deployment context to narrow down the cause. Observability is not a product you buy once; it is an instrumentation and operating practice. Poorly named metrics or logs full of private data create cost and privacy risks without improving diagnosis.
A practical system often includes:
- Availability checks for the public route and critical user journey.
- Metrics for request volume, latency, error rate, saturation, and dependency health.
- Structured logs that describe relevant events and error context.
- Distributed traces that show how a request moved between components.
- Error monitoring that groups exceptions and connects them to releases.
- Runbooks and alerts that identify an owner and a first response step.
Logs: what happened?
A log event records a discrete occurrence: a request was rejected, a cache missed, an upstream lookup timed out, or a configuration version was loaded. Structured logs use stable fields such as timestamp, severity, service, environment, request ID, status code, and error type. A consistent format makes it easier to filter by service or compare deployments.
Avoid turning logs into a copy of every request. Full URLs may contain search terms or identifiers; bodies may include personal data, credentials, or commercially sensitive domain candidates. Log only what is necessary for debugging and security, redact secrets before export, restrict access, and set a retention period. If a value is useful only in aggregate, count it instead of storing it verbatim.
A useful error entry might say that a lookup request timed out after a configured limit and include a request ID, provider name, and normalized error category. It should not include an API key, full authorization header, or raw customer profile. The exact fields depend on the service’s privacy and security requirements.
Metrics: how much and how often?
A metric is a measurement collected over time. Common service indicators include request rate, error rate, latency distribution, and resource saturation. Average latency alone can hide slow requests, so teams often inspect percentiles such as p50, p95, or p99. Those percentiles summarize a distribution; they are not promises for each individual visitor.
For an API, useful metrics may include:
- Requests by endpoint and status class.
- Latency by endpoint and upstream dependency.
- Timeout and retry counts.
- Cache hit and miss counts, if caching is used.
- Queue depth and oldest-message age for background work.
- Process, database, or provider connection saturation.
Keep metric dimensions bounded. A label containing every user-provided domain or full URL can create an unbounded number of time series, increase cost, and expose private inputs. Prefer categories such as endpoint, status class, and provider region where appropriate. Do not use a metric label as a secret storage location.
An availability objective should reflect the user’s task. For a domain name tool, “homepage returns 200” is not enough if the generator script fails to load or the lookup API is broken. Define what success means, how it is measured, and what error budget or response process the team can support. Avoid choosing targets solely because another company uses them.
Traces: where did the request go?
A trace represents one end-to-end request as a set of spans. A browser request may pass through an edge proxy, API gateway, application service, cache, database, and external provider. Each span can record its operation, duration, status, and parent relationship. Trace context or a request ID helps services connect those events.
A simplified trace might look like:
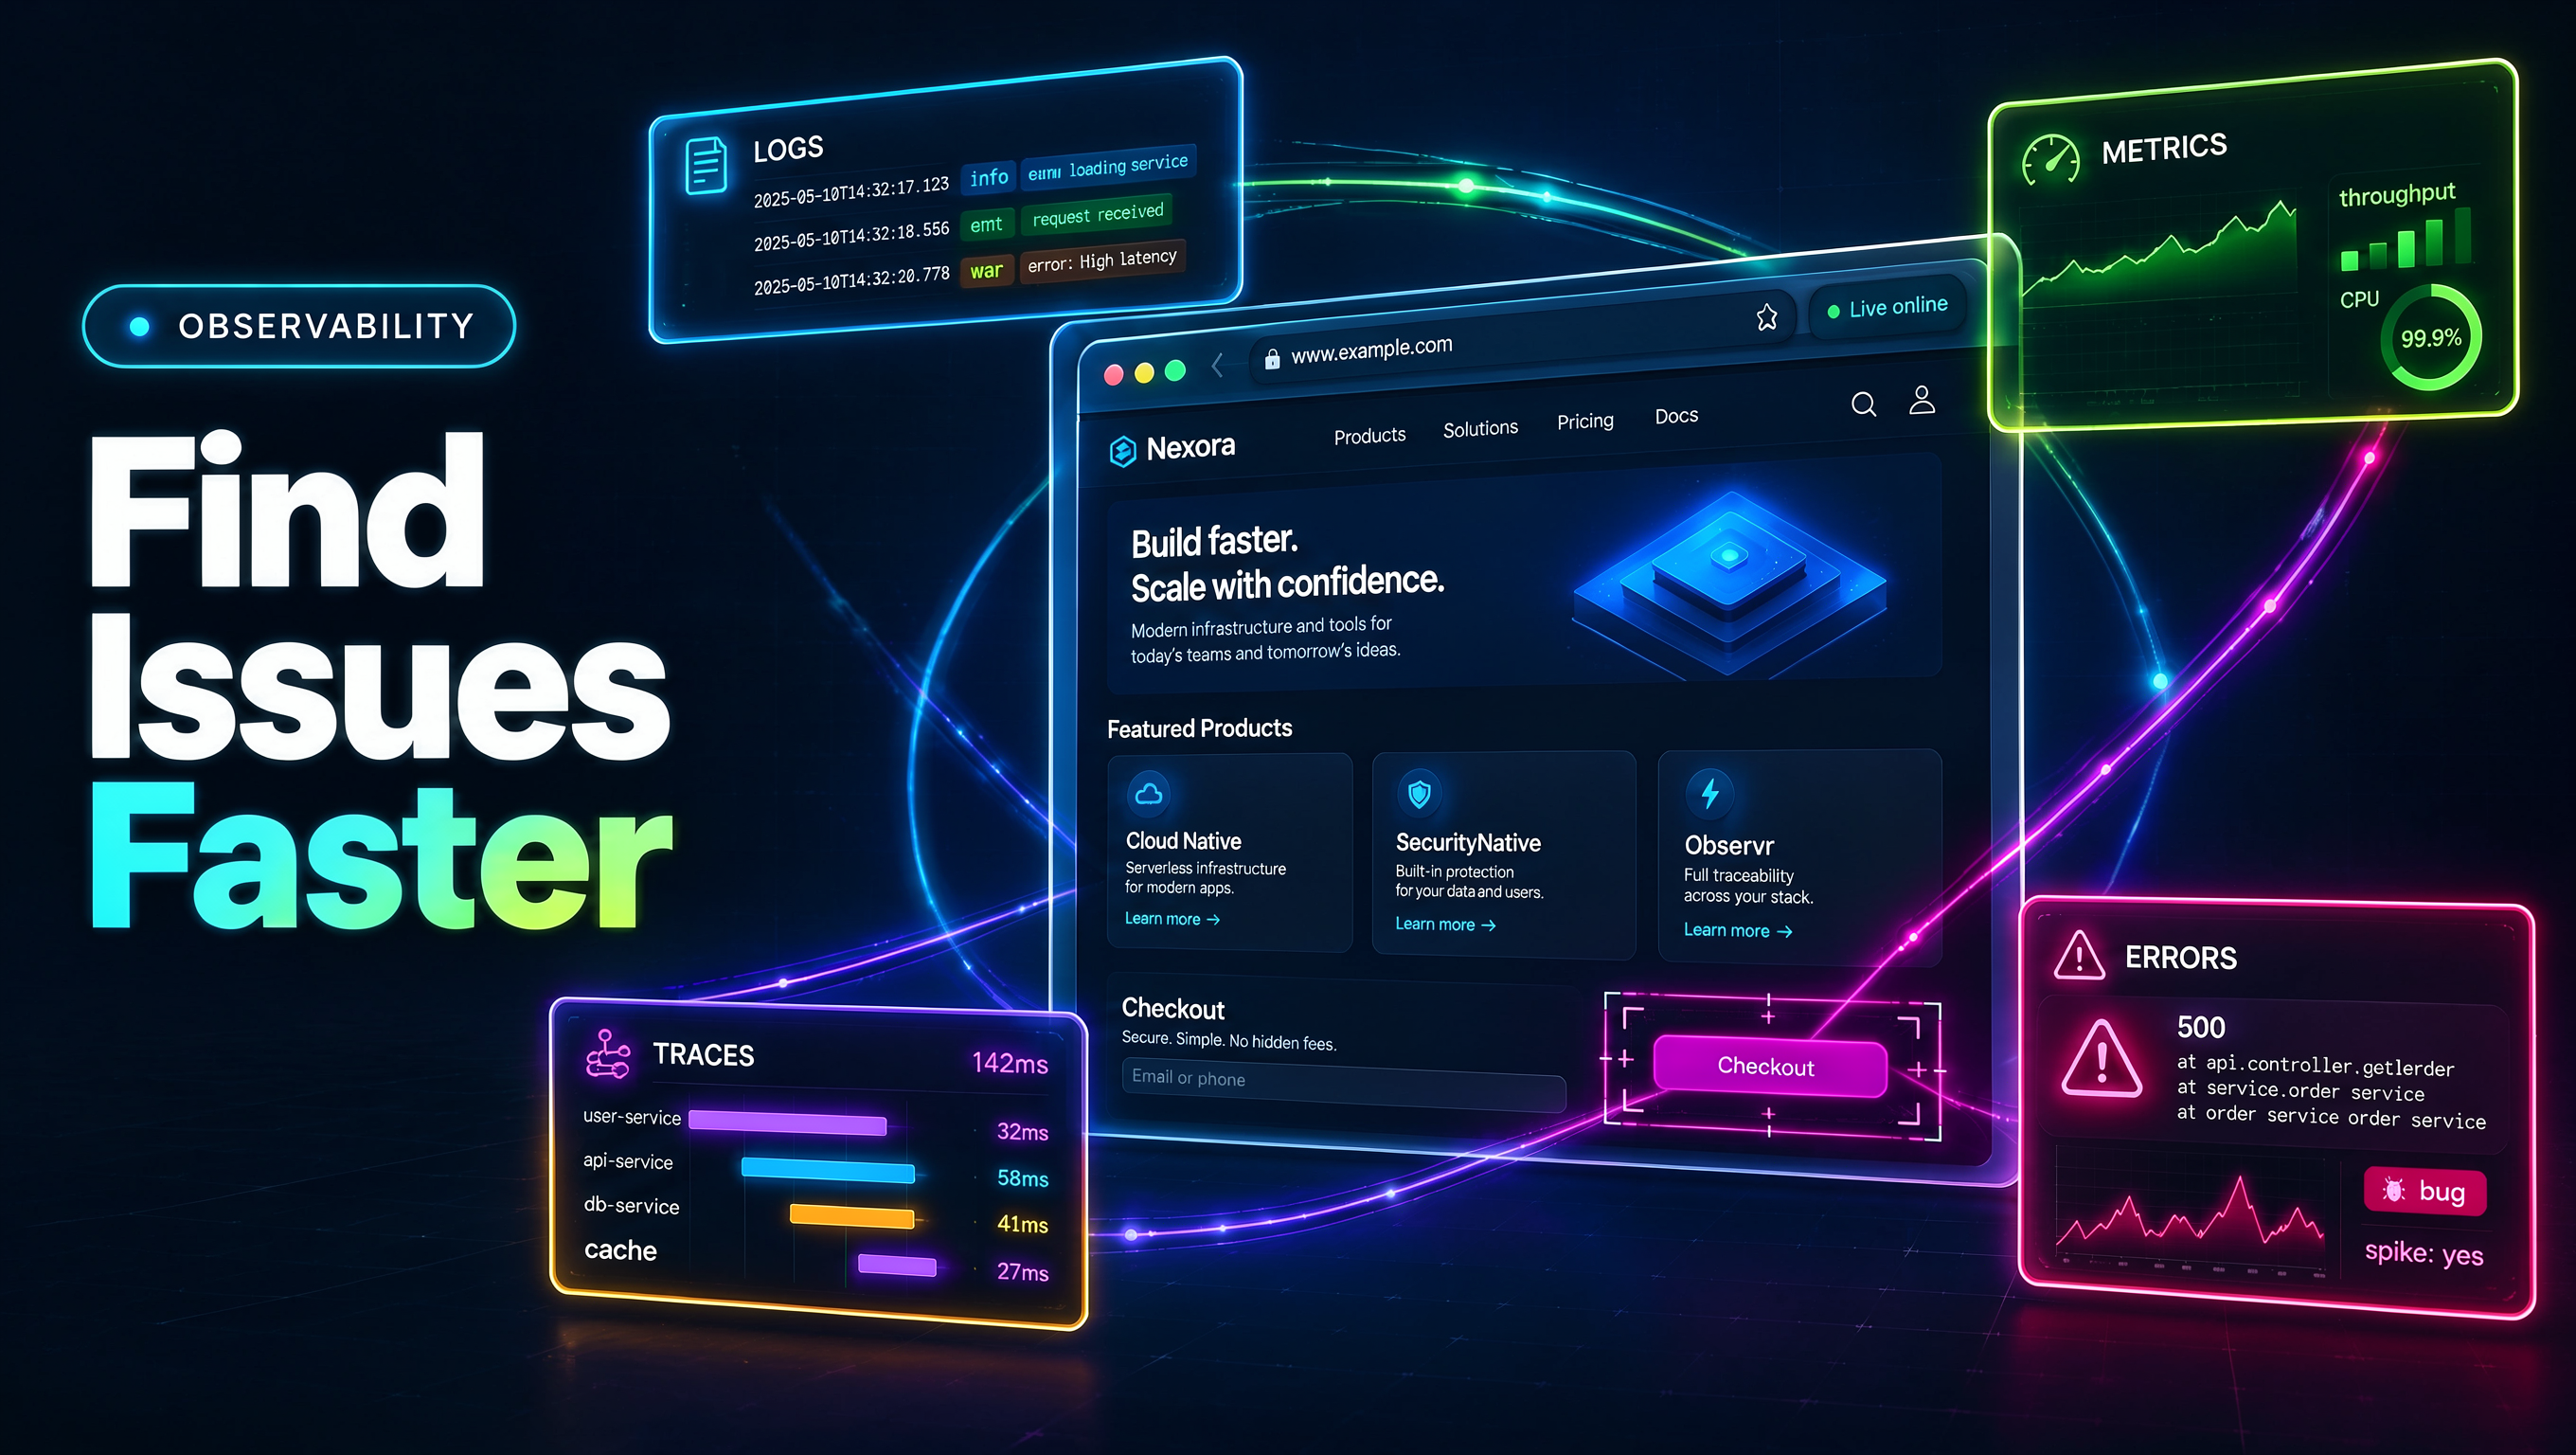
These values are an illustrative diagram, not measured performance data. In a real trace, inspect the recorded time range, sampling policy, and missing spans. A trace can show where time was spent, but it cannot establish that the provider’s answer was accurate or that a user’s result was legally sufficient.
Do not attach user-entered names, tokens, or entire response bodies to spans by default. Propagate only the context needed to correlate the request. If a third-party tracing service receives telemetry, review its data handling and retention terms.
Request IDs, error monitoring, and incident response
A request ID gives support and operations a safe reference to a specific request. Generate it at a trusted boundary or validate an incoming identifier before accepting it. Return it in an error message so a user can report the issue without sending sensitive data in an email. Include it in relevant logs and traces, but do not use it as an authentication token.
Error monitoring can group repeated exceptions, show the first and last occurrence, and connect a stack trace to a release. Configure it to redact personal data and secrets. Use source maps carefully: they help diagnose minified front-end errors but should not expose private source code or configuration. Test the reporting path so a monitoring outage does not break the application.
An alert should be actionable. It needs an owner, a condition that signals a real user problem, a runbook or first step, and an escalation route. Alerting on every warning creates fatigue. A useful alert might fire when lookup errors remain elevated or when a dependency outage prevents a core task, not merely when a single isolated request fails.
Observability plan for a domain generator
For a browser-only generator, measure whether the page and script load, whether generation errors occur, and whether core controls remain usable. Avoid collecting every generated name; the visitor may be considering a confidential brand. A local feature can be monitored with privacy-conscious aggregate events, browser error reports with redaction, and synthetic checks using clearly fictional inputs.
For a server-backed lookup service, add endpoint-level latency, upstream timeout, quota rejection, cache behavior, and unknown-result counts. Distinguish provider errors from a valid “no record returned” response. Attach a request ID through the gateway and service. Monitor cost and request volume so a crawler or bug does not create a large bill.
A starter checklist:
- Define the user journey and what counts as success.
- Identify the components and dependencies on that path.
- Add bounded metrics for request volume, errors, latency, and saturation.
- Add structured logs with request IDs and no unnecessary sensitive data.
- Trace cross-service requests and sample responsibly.
- Create alerts for sustained user-impacting conditions and document response steps.
- Run a synthetic test that checks more than the homepage status.
- Test that privacy filters remove tokens and user inputs from telemetry.
- Review dashboards after releases and verify an incident can be traced end to end.
- Periodically test alert delivery, runbooks, and data retention.
Dashboard design: show a question, not a pile of graphs
A useful dashboard helps an operator answer a specific question. A service overview might show request volume, error rate, latency distribution, and saturation for the main user journey. A dependency view can show provider timeouts and quota responses separately from application errors. A release marker helps connect a change to a shift in behavior. Avoid a chart for every available field; too many panels make it harder to notice a real problem.
Display units, time range, aggregation, and data freshness. A p95 latency line should say which endpoint and population it summarizes. An error rate should distinguish client mistakes from server failures if that distinction helps the response. Do not show a made-up success number in a sample dashboard as though it came from production. For a new service, use an empty or clearly labeled illustrative panel until real telemetry exists.
Cardinality, sampling, and retention
High-cardinality labels—such as a unique domain, full URL, or request ID—can create a separate time series for every value. That can increase storage and query cost without making a dashboard more useful. Keep request IDs in logs or traces where they can be searched, not as a metric dimension. Use low-cardinality categories such as endpoint name, status class, and error type.
Tracing every request may be unnecessary or expensive. Sampling can reduce volume, but consider how it affects rare failures and sensitive data. Keep error traces or important events according to a reviewed policy, and avoid retaining full prompts or payloads by default. Set access controls and retention periods across the telemetry provider, not only in application code.
Service objectives and alert thresholds
A service-level indicator is a measurement tied to a user-visible outcome, such as successful completion of a lookup request within a time budget. A service-level objective is a target for that indicator over a defined period. Choose a target the team can support and explain what happens when the system falls outside it. An internal objective should not be advertised as a guarantee unless the service contract actually says so.
Start alerts from user impact and operational capacity. A sustained increase in unknown provider responses may deserve an alert if the feature depends on that provider; a small transient spike may not. Pair each alert with a runbook, an owner, and a way to verify recovery. Revisit thresholds after observing real traffic rather than treating the first chosen number as permanent.
Review dashboards during an incident
During an incident, assign one person to coordinate response and keep a timestamped record of the key observations. Separate observed facts from hypotheses: “provider timeouts increased after 14:00” is a fact; “the provider caused the outage” may still need verification. Use trace and request identifiers to sample affected requests, compare with an unaffected path, and check the latest deployment or configuration change. Limit dashboard access to the people who need it, and redact screenshots before sharing them outside the organization.
After recovery, ask whether the alert fired at the right time, whether the dashboard exposed the relevant dependency, and whether telemetry was missing or too noisy. Turn useful findings into a test, runbook update, or instrumentation improvement. Avoid retaining a detailed trace forever if a short incident window is enough for diagnosis.
Frequently asked questions
Is observability just more logging? No. Logs are one signal. Metrics, traces, error reports, deployment metadata, and the ability to investigate an unknown failure all contribute.
Do I need distributed tracing for a static site? Not necessarily. A static site may need simple availability and browser-error monitoring. Add tracing when requests cross services and correlation helps solve problems.
Should I log every user search? Usually not without a clear, disclosed need. Consider aggregate metrics or synthetic checks that do not retain user-entered data.
What is the difference between a request ID and a trace ID? A request ID can identify one application-level request; a trace ID commonly groups spans across services. Exact conventions depend on the instrumentation standard.
Can a green uptime check prove the site works? No. It may confirm a route responds while a key control, API, database, or workflow is failing. Monitor the user journey that matters.
Conclusion
Observability is the ability to investigate system behavior with useful, trustworthy signals. Choose metrics that reflect real user tasks, logs that explain failures without exposing private inputs, and traces that reveal cross-service delay. Connect the signals with a request identifier, keep alerts actionable, and test the monitoring itself. A site is easier to operate when an incident can be followed from the user’s symptom to the component that caused it.